How to Measure the ROI of Your Video Content (3-Tier Framework)
Stop guessing. Use this 3-tier framework to measure actual video ROI, from engagement metrics to revenue attribution. Real examples included.
on November 2, 2025 • 9 Min Read
“The video’s great, but how do we know it’s actually working?”
We hear this on every discovery call. Business owners want proof—not just “it looks good.”
Here’s the reality: 93% of video marketers report positive ROI with an average 5:1 return. But knowing video can work and proving yours works are different things.
The difference? A proper measurement framework.
Why Most Video ROI Calculations Fail
Four common mistakes tank video measurement:
The vanity metrics trap. “Our video got 10,000 views!” means nothing if none became customers.
Single-touch attribution. Crediting video alone ignores the full customer journey. Buyers interact with multiple touchpoints before deciding.
Wrong KPIs. Measuring what looks impressive instead of what drives growth. Completion rates matter less than qualified leads.
No baseline. Without knowing your starting point, you can’t measure improvement.
The 3-Tier ROI Framework
Here’s the measurement system that actually delivers insights:
Tier 1: Engagement (Short-term)
- Video completion rates
- Click-through rates to website
- Time on landing pages post-video
- Social sharing and engagement
Tier 2: Lead Generation (Medium-term)
- Form submissions from video viewers
- Phone inquiries mentioning video
- Email signups attributed to video
- Meeting requests from video pages
Tier 3: Revenue Attribution (Long-term)
- Closed deals with video-influenced first contact
- Customer lifetime value changes
- Referral rates from video viewers
- Repeat business attribution
The key: Track all three tiers simultaneously. Engagement without leads is noise. Leads without revenue data is guesswork.
Real-World Example: 747% ROI
Here’s how proper measurement works in practice:
The setup:
- 3 documentary-style customer story videos
- $15,000 production investment
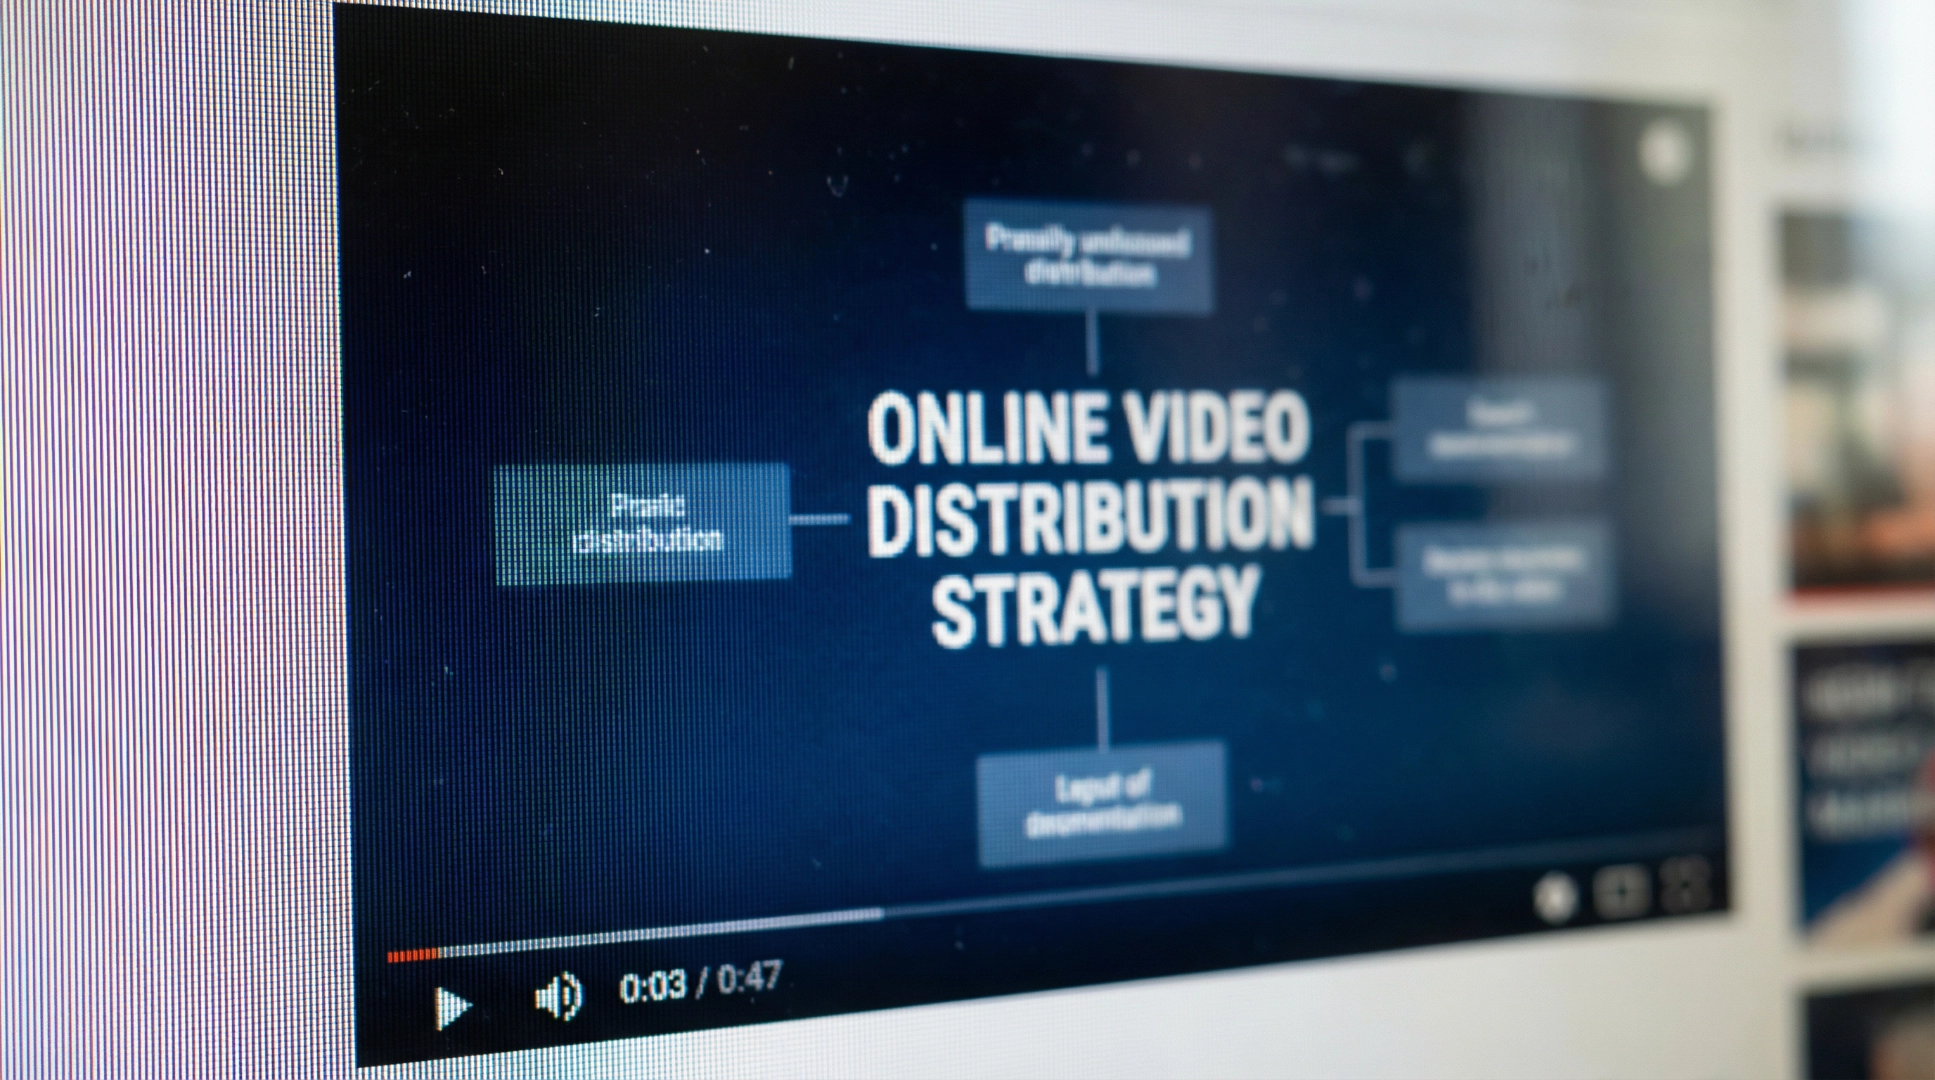
- Distribution: website, LinkedIn, email
60-day results:
| Metric | Result | Benchmark |
|---|---|---|
| Completion rate | 89% | 23% industry avg |
| Qualified inquiries | 47 | Mentioning video |
| Sales meetings | 23 | From video viewers |
| Closed revenue | $127,000 | Direct attribution |
ROI: 747% return. Payback period: 23 days.
The authentic documentary approach drove 3x higher completion rates—which directly correlated with lead quality and conversions.
Essential KPIs by Business Type
Lead Generation Companies
Track first:
- Cost per qualified lead from video traffic
- Lead-to-opportunity conversion rate
- Sales cycle length for video-educated prospects
- Average deal size for video-influenced customers
Product/Sales Companies
Track first:
- Direct sales attribution to video
- Cart conversion rates with video
- Product page engagement time
- Customer acquisition cost changes
Multi-Touch Attribution (The Right Way)
Single-touch attribution lies. Here’s a weighted model that reflects reality:
| Touchpoint | Weight | Role |
|---|---|---|
| Video content | 40% | Awareness + emotional connection |
| Landing page | 25% | Information + lead capture |
| Email follow-up | 20% | Nurturing |
| Sales contact | 15% | Closing |
This model acknowledges that video often starts the conversation—even when other channels close it.
Red Flags: When Video ROI Isn’t Working
Monitor these warning signs:
- Completion rates below 20% → Content problem
- Video leads converting under 10% → Targeting problem
- No revenue correlation → Attribution problem
- High bounce rates after video → Technical problem
Quick Diagnostic
Can you answer these questions?
- What percentage of viewers complete your video?
- How many viewers request more information?
- What’s your video-to-lead conversion rate?
- How much revenue ties directly to video?
If not, your measurement framework needs work.
Your 30-Day Measurement Kickstart
Week 1: Audit current metrics. Establish baselines.
Week 2: Set up tracking—UTM parameters, conversion pixels, CRM integration.
Week 3: Launch video with full measurement in place.
Week 4: Review data. Optimize distribution. Gather sales team feedback.
Month 1 success metrics:
- Completion rates above 30%
- 5%+ of viewers take next action
- Clear video-to-website attribution
- Sales team confirms lead quality
The ROI Formula
Basic calculation:
ROI = (Revenue Generated - Video Investment) / Video Investment × 100Example:
- Investment: $8,000 (production)
- Revenue generated: $67,000 (attributed sales)
- ROI: ($67,000 - $8,000) / $8,000 × 100 = 738% ROI
But that’s overly simple. Here’s what you’re actually measuring:
The Complete ROI Model
Direct Revenue Impact:
- New customer sales attributed to video
- Upsells to existing customers who watched
- Deal acceleration (closed faster due to video)
Cost Savings:
- Reduced sales cycle length
- Lower customer acquisition cost
- Decreased support inquiries (explainer videos)
- Time saved by sales team (video does initial qualification)
Long-term Value:
- Customer lifetime value increase
- Referral rate improvements
- Brand equity growth
- Recruitment cost reduction (if using for hiring)
Real Numbers from Southern Alberta Clients
Manufacturing Company: Recruitment Video
Investment: $12,000 Timeline: 4 weeks production
Results (6 months):
- 47,000 views across platforms
- 23 qualified applications (previous recruitment efforts: 4-6 applications)
- 12 hires from video applicants
- Turnover reduction: 40% in first year
ROI Calculation:
- Cost to replace employee: ~$15,000 (recruiting + training + lost productivity)
- Employees retained due to better cultural fit: 5
- Savings: 5 × $15,000 = $75,000
- ROI: ($75,000 - $12,000) / $12,000 = 525% ROI
Energy Company: Stakeholder Communication
Investment: $15,000 (3 videos) Timeline: 6 weeks production
Results (60 days):
- 89% completion rate (vs 23% industry average)
- 47 qualified inquiries mentioning video
- 23 sales meetings booked
- $127,000 in closed deals directly attributed
ROI: ($127,000 - $15,000) / $15,000 = 747% ROI Payback period: 23 days
Agriculture Co-op: Brand Awareness Campaign
Investment: $10,000 Timeline: 5 weeks production
Results (90 days):
- 156,000 organic views
- 2,400 website visits from video
- 340 new email subscribers
- 67 membership applications
- $43,000 in new membership revenue
ROI: ($43,000 - $10,000) / $10,000 = 330% ROI
The pattern: Authentic storytelling consistently delivers 300-700% ROI when properly measured.
How to Set Up Proper Tracking
Most companies fail at measurement because they don’t set up tracking before launch. Here’s what you need:
Technical Setup (Week 1-2)
1. UTM Parameters
Tag every video link with tracking codes:
https://yoursite.com/services?utm_source=youtube&utm_medium=video&utm_campaign=brand_story_2025This tells Google Analytics exactly where traffic came from.
2. Conversion Pixels
Install these before you launch:
- Facebook Pixel (if using paid distribution)
- LinkedIn Insight Tag (for B2B)
- Google Analytics events (for video plays, completions, clicks)
3. CRM Integration
Connect your video metrics to your CRM:
- Tag leads that came from video viewers
- Track which videos they watched
- Monitor their journey through your sales funnel
- Attribute revenue to specific video content
4. Video Hosting Analytics
Use platforms that track detailed metrics:
- Vimeo Pro: Completion rates, engagement graphs, heatmaps
- Wistia: Lead capture, CTA clicks, A/B testing
- YouTube Analytics: Watch time, demographics, traffic sources
What to Track (and Why)
Tier 1 Metrics: Engagement
- Views (total reach)
- Completion rate (content quality)
- Average watch time (engagement level)
- Social shares (viral potential)
Tier 2 Metrics: Lead Generation
- Video-to-website clicks (intent)
- Form fills from video pages (qualified interest)
- CTA clicks (action taken)
- Email/phone contact from video viewers
Tier 3 Metrics: Revenue
- Deals with video in customer journey (attribution)
- Revenue from video-influenced leads (direct impact)
- Customer lifetime value of video leads vs. other sources (quality)
- Time to close for video-educated prospects (efficiency)
Common Measurement Mistakes to Avoid
Mistake 1: Only Tracking Views
10,000 views means nothing if:
- 95% bounced after 5 seconds
- Zero converted to leads
- None resulted in revenue
Fix: Track completion rate and conversion, not just views.
Mistake 2: No Control Group
How do you know the video caused the improvement?
Fix: Compare periods before/after video launch. Or compare video viewers vs. non-viewers in your CRM.
Mistake 3: Ignoring Assisted Conversions
Video rarely gets 100% of the credit. Someone might:
- Watch video
- Visit website later
- Read case study
- Contact sales
- Close deal
Google Analytics defaults to “last click” attribution—giving credit to step 4, not the video.
Fix: Use Google Analytics “Assisted Conversions” report to see video’s true impact.
Mistake 4: Not Tracking Negative Metrics
What if your video is hurting performance?
Monitor:
- Bounce rate (are people leaving immediately?)
- Unsubscribes after video emails
- Negative comments/feedback
- Drop-off points in video (where do people quit?)
If bounce rate spikes after video launch, you have a targeting or content problem.
The 90-Day Measurement Plan
Here’s exactly what to do:
Days 1-30: Establish Baseline
- Document current conversion rates without video
- Set up all tracking infrastructure
- Launch video with full measurement in place
Days 31-60: Gather Initial Data
- Monitor all three metric tiers
- Look for early win signals (completion rates, click-throughs)
- Make minor optimization adjustments (CTA placement, distribution channels)
Days 61-90: Calculate ROI
- Pull complete data set
- Calculate direct attribution
- Identify assisted conversions
- Present findings to stakeholders
Success Benchmarks:
- Completion rate >40% (documentary-style average: 73%)
- Video-to-website click rate >5%
- Lead conversion >2% of viewers
- Positive ROI within 90 days
When Video ROI Doesn’t Work
Sometimes video legitimately doesn’t deliver. Here’s when:
Wrong Use Case
- Trying to sell complex B2B services with a 30-second clip
- Using video for audiences that prefer text (highly technical buyers sometimes do)
- Expecting immediate sales from brand awareness content
Wrong Distribution
- Great video, zero promotion
- Posting once on YouTube and hoping for magic
- No paid amplification for competitive markets
Wrong Story
- Generic corporate messaging that could be anyone
- No clear call-to-action
- Failing to address viewer’s actual pain points
Wrong Measurement
- Expecting recruitment video to generate immediate sales
- Measuring brand awareness video with direct response metrics
- Not giving video enough time to compound (most ROI happens months 3-12, not month 1)
The Bottom Line
Video ROI is measurable. But measurement requires:
- Clear objectives before production
- Proper tracking setup before launch
- Commitment to analyzing actual data, not vanity metrics
- Patience for compounding results
The companies seeing 300-700% ROI aren’t lucky. They’re systematic about measurement.
Ready to measure what matters?
Book a discovery call and we’ll help you set up a measurement framework that proves ROI—or shows you what needs to change.
Related Resources: